Mastering Technical Analysis: Key Indicators to Predict Market Trends in Crypto
The cryptocurrency market is known for its volatility and rapid price changes, making it both a challenging and exciting space for traders. Mastering technical analysis is crucial for anyone looking to predict market trends and make informed trading decisions. This article explores key indicators that can help traders navigate the crypto market effectively.
Understanding Technical Analysis
Technical analysis involves studying past market data, primarily price and volume, to forecast future price movements. Unlike fundamental analysis, which focuses on the intrinsic value of an asset, technical analysis is based on the belief that historical trading activity can indicate future price trends.
Key Indicators in Technical Analysis
Moving Averages
Moving averages are one of the most commonly used indicators in technical analysis. They smooth out price data to identify trends over a specific period. There are two main types:
- Simple Moving Average (SMA): This is the average price over a set number of periods. For example, a 50-day SMA calculates the average price over the last 50 days.
- Exponential Moving Average (EMA): This gives more weight to recent prices, making it more responsive to new information.
Traders often use moving averages to identify support and resistance levels. For instance, if the price of Bitcoin crosses above its 200-day SMA, it might signal a bullish trend.
Relative Strength Index (RSI)
The Relative Strength Index (RSI) is a momentum oscillator that measures the speed and change of price movements. It ranges from 0 to 100 and is typically used to identify overbought or oversold conditions.
- Overbought: An RSI above 70 may indicate an asset is overbought and could be due for a price correction.
- Oversold: An RSI below 30 suggests that an asset is oversold and might experience a price increase.
For example, during the 2021 crypto bull run, Ethereum’s RSI frequently entered the overbought territory, signalling potential pullbacks.

Bollinger Bands
Bollinger Bands consist of a middle band (SMA) and two outer bands that represent standard deviations from the middle band. They are used to measure market volatility.
- Narrow Bands: Indicate low volatility and potential for a breakout.
- Wide Bands: Suggest high volatility and potential for a trend reversal.
Traders often look for price movements outside the bands as signals for potential buy or sell opportunities.
MACD (Moving Average Convergence Divergence)
The MACD is a trend-following momentum indicator that shows the relationship between two moving averages of an asset’s price. It consists of the MACD line, signal line, and histogram.
- MACD Line: The difference between the 12-day EMA and the 26-day EMA.
- Signal Line: A 9-day EMA of the MACD line.
- Histogram: The difference between the MACD line and the signal line.
When the MACD line crosses above the signal line, it may indicate a bullish trend, while a cross below suggests a bearish trend.
 Case Study: Bitcoin’s 2020 Bull Run
During Bitcoin’s 2020 bull run, several technical indicators provided valuable insights:
- Moving Averages: Bitcoin’s price consistently stayed above its 50-day and 200-day SMAs, indicating a strong uptrend.
- RSI: The RSI frequently entered overbought territory, suggesting potential corrections, which often occurred.
- Bollinger Bands: The bands widened significantly during periods of high volatility, signalling potential trend reversals.
These indicators helped traders make informed decisions during one of the most significant bull runs in crypto history.
How to Master Technical Analysis to Navigate Crypto Market Trends
As the crypto market continues to evolve with unprecedented volatility and complexity, traders and investors are increasingly turning to technical analysis to gain a competitive edge. This article explores essential indicators such as moving averages, relative strength index (RSI), and Fibonacci retracements, among others, providing readers with the tools needed to interpret market signals and make informed trading decisions. By demystifying these key concepts, the book empowers both novice and experienced traders to navigate the crypto landscape with confidence, enhancing their ability to anticipate market movements and optimize their investment strategies.
Understanding Moving Averages: A Guide to Identifying Trends in Crypto Markets
In cryptocurrency trading, understanding market trends is crucial for making informed investment decisions. One of the most effective tools for identifying these trends is the moving average, a fundamental component of technical analysis. Moving averages help traders smooth out price data, providing a clearer picture of the market’s direction over a specified period. By analyzing these averages, traders can gain insights into potential future price movements, making them an indispensable tool in the crypto market.
To begin with, moving averages are calculated by taking the average of a set number of past data points. This calculation can be applied to any time frame, from minutes to months, depending on the trader’s strategy. The two most commonly used types of moving averages are the simple moving average (SMA) and the exponential moving average (EMA). The SMA is calculated by adding the closing prices of an asset over a specific period and then dividing by the number of periods. In contrast, the EMA gives more weight to recent prices, making it more responsive to new information.
The choice between using an SMA or an EMA depends on the trader’s objectives. For those seeking to identify long-term trends, the SMA is often preferred due to its stability and simplicity. However, for traders looking to capitalize on short-term price movements, the EMA’s sensitivity to recent price changes can provide a more timely signal. Regardless of the type chosen, moving averages serve as a foundation for identifying trends and potential reversal points in the market.
One of the primary ways traders use moving averages is to identify trend direction. When the price of a cryptocurrency is above its moving average, it is generally considered to be in an uptrend. Conversely, when the price is below the moving average, it is seen as being in a downtrend. This basic principle allows traders to align their strategies with the prevailing market trend, increasing the likelihood of successful trades.
Moving averages can also be used to identify support and resistance levels. In an uptrend, a moving average can act as a support level, where the price tends to bounce back after touching the average. In a downtrend, it can serve as a resistance level, where the price struggles to break through. These levels are crucial for traders as they provide potential entry and exit points, helping to maximize profits and minimize losses.
In addition to identifying trends and support/resistance levels, moving averages are often used in conjunction with other technical indicators to enhance their predictive power. For instance, the moving average convergence divergence (MACD) indicator uses moving averages to identify changes in momentum, providing traders with additional insights into potential trend reversals. By combining moving averages with other indicators, traders can develop a more comprehensive understanding of market dynamics.
In summary, mastering the use of moving averages is essential for any trader looking to navigate the volatile crypto markets. By providing a clear view of market trends, moving averages enable traders to make more informed decisions, ultimately leading to more successful trading outcomes. As with any tool, the key to effective use lies in understanding its strengths and limitations, as well as integrating it into a broader trading strategy. With practice and experience, traders can harness the power of moving averages to predict market trends and achieve their investment goals.
The Power of RSI: How the Relative Strength Index Can Signal Market Reversals
In the ever-evolving world of cryptocurrency trading, mastering technical analysis is crucial for investors seeking to predict market trends and make informed decisions. Among the myriad of tools available, the Relative Strength Index (RSI) stands out as a powerful indicator that can signal potential market reversals. Understanding how to effectively utilize the RSI can provide traders with a significant edge in navigating the volatile crypto markets.
The RSI, developed by J. Welles Wilder in 1978, is a momentum oscillator that measures the speed and change of price movements. It is typically used to identify overbought or oversold conditions in a market, which can indicate potential reversals. The RSI is calculated using a formula that compares the magnitude of recent gains to recent losses, resulting in a value that ranges from 0 to 100. Generally, an RSI above 70 suggests that an asset may be overbought, while an RSI below 30 indicates that it may be oversold.
One of the key strengths of the RSI is its ability to provide early warning signals of potential trend reversals. For instance, when the RSI crosses above the 70 level, it may suggest that the asset is overbought and due for a correction. Conversely, when the RSI falls below the 30 level, it may indicate that the asset is oversold and poised for a rebound. These signals can be particularly valuable in the crypto market, where rapid price swings are common.
Moreover, the RSI can be used in conjunction with other technical indicators to enhance its predictive power. For example, traders often combine the RSI with moving averages to confirm potential reversals. When the RSI indicates an overbought condition and the price is also above a key moving average, it may strengthen the case for a potential downward reversal. Similarly, an oversold RSI reading coupled with a price below a moving average can reinforce the likelihood of an upward reversal.
In addition to identifying overbought and oversold conditions, the RSI can also be used to spot divergences, which occur when the price of an asset moves in the opposite direction of the RSI. A bullish divergence, where the price makes a lower low while the RSI makes a higher low, can signal a potential upward reversal. Conversely, a bearish divergence, where the price makes a higher high while the RSI makes a lower high, may indicate a potential downward reversal. These divergences can serve as powerful signals for traders looking to capitalize on market reversals.
However, it is important to note that the RSI, like any technical indicator, is not infallible. It should be used as part of a comprehensive trading strategy that considers other factors such as market fundamentals and sentiment. Additionally, the RSI may generate false signals in trending markets, where prices can remain overbought or oversold for extended periods. Therefore, traders should exercise caution and use the RSI in conjunction with other tools and analysis techniques.
In summary, the Relative Strength Index is a valuable tool for traders seeking to predict market trends and identify potential reversals in the crypto market. By understanding how to interpret RSI signals and combining them with other indicators, traders can enhance their ability to navigate the complexities of cryptocurrency trading. As with any trading strategy, it is essential to remain vigilant and adapt to changing market conditions to achieve long-term success.
Decoding MACD: Using the Moving Average Convergence Divergence for Crypto Trading
The Moving Average Convergence Divergence (MACD) stands out as a powerful indicator for predicting market trends. Understanding how to effectively utilize the MACD can significantly enhance a trader’s ability to navigate the volatile crypto markets.
The MACD is a trend-following momentum indicator that reveals the relationship between two moving averages of a security’s price. It is composed of three main components: the MACD line, the signal line, and the histogram. The MACD line is calculated by subtracting the 26-period Exponential Moving Average (EMA) from the 12-period EMA. The signal line, typically a 9-period EMA of the MACD line, acts as a trigger for buy and sell signals. The histogram, which represents the difference between the MACD line and the signal line, provides a visual representation of momentum.
To effectively use the MACD in crypto trading, it is essential to understand the significance of its crossovers. A bullish signal is generated when the MACD line crosses above the signal line, indicating potential upward momentum. Conversely, a bearish signal occurs when the MACD line crosses below the signal line, suggesting possible downward momentum. These crossovers are pivotal moments that can guide traders in making buy or sell decisions.
Moreover, the MACD can be used to identify overbought or oversold conditions in the market. When the MACD line is significantly above the signal line, it may indicate that the asset is overbought and due for a correction. Conversely, when the MACD line is well below the signal line, it may suggest that the asset is oversold and poised for a rebound. Recognizing these conditions can help traders anticipate potential reversals and adjust their strategies accordingly.
In addition to crossovers and overbought/oversold conditions, a divergence between the MACD and the price action of a cryptocurrency can provide valuable insights. A bullish divergence occurs when the price makes a lower low while the MACD forms a higher low, indicating weakening downward momentum and a potential reversal to the upside. On the other hand, a bearish divergence is observed when the price reaches a higher high while the MACD forms a lower high, signalling waning upward momentum and a possible reversal to the downside. Identifying these divergences can offer traders early warning signs of trend changes.
While the MACD is a robust tool, it is important to use it in conjunction with other indicators and analysis techniques to confirm signals and reduce the risk of false readings. Combining the MACD with support and resistance levels, trend lines, or other momentum indicators can provide a more comprehensive view of the market and enhance decision-making.
In summary, the Moving Average Convergence Divergence is an indispensable tool for crypto traders seeking to master technical analysis. By understanding its components and effectively interpreting its signals, traders can gain valuable insights into market trends and make more informed trading decisions. As with any trading strategy, it is crucial to practice due diligence and continuously refine one’s approach to adapt to the dynamic nature of the cryptocurrency markets.
Fibonacci Retracement: Leveraging Key Levels for Predicting Crypto Price Movements
Fibonacci retracement is a powerful tool in the arsenal of technical analysis, particularly when it comes to predicting price movements in the volatile world of cryptocurrency. This method, rooted in the mathematical principles discovered by Leonardo Fibonacci, involves using horizontal lines to indicate areas of support or resistance at the key Fibonacci levels before the price continues in the original direction. These levels are derived from the Fibonacci sequence, a series of numbers where each number is the sum of the two preceding ones, which surprisingly finds application in various natural phenomena and financial markets alike.
In the context of cryptocurrency trading, Fibonacci retracement levels are used to identify potential reversal points in the market. The most commonly used Fibonacci retracement levels are 23.6%, 38.2%, 50%, 61.8%, and 100%. These percentages represent how much of a prior move the price has retraced. For instance, if a cryptocurrency’s price rises from $100 to $200, a retracement to $150 would be a 50% retracement. Traders often look for these levels to act as potential support or resistance zones, where the price might pause or reverse its direction.
The application of Fibonacci retracement in crypto trading is particularly significant due to the market’s inherent volatility. Cryptocurrencies are known for their rapid price swings, and identifying key levels where these swings might stall or reverse can provide traders with valuable insights. By plotting these levels on a price chart, traders can anticipate potential areas where buying or selling pressure might emerge, thus allowing them to make more informed trading decisions.
Moreover, Fibonacci retracement is often used in conjunction with other technical analysis tools to enhance its predictive power. For example, when a Fibonacci level coincides with a trend line or a moving average, it can strengthen the level’s significance as a potential reversal point. This confluence of indicators can provide traders with greater confidence in their analysis, as multiple signals suggest a higher probability of a price reaction at that level.
Despite its utility, it is important to note that Fibonacci retracement is not a foolproof method. The crypto market is influenced by a myriad of factors, including market sentiment, regulatory developments, and macroeconomic trends, which can all impact price movements. Therefore, while Fibonacci retracement can provide valuable insights, it should not be used in isolation. Traders are advised to consider a holistic approach, incorporating fundamental analysis and other technical indicators to build a comprehensive trading strategy.
In summary, Fibonacci retracement is a valuable tool for predicting price movements in the cryptocurrency market. By identifying key levels of support and resistance, traders can gain insights into potential reversal points, allowing them to make more informed trading decisions. However, it is crucial to remember that no single indicator can guarantee success in the highly unpredictable world of crypto trading. By combining Fibonacci retracement with other analytical tools and maintaining a disciplined approach, traders can enhance their ability to navigate the complexities of the market and improve their chances of achieving favourable outcomes.
Candlestick Patterns: Analyzing Price Action to Forecast Crypto Market Trends
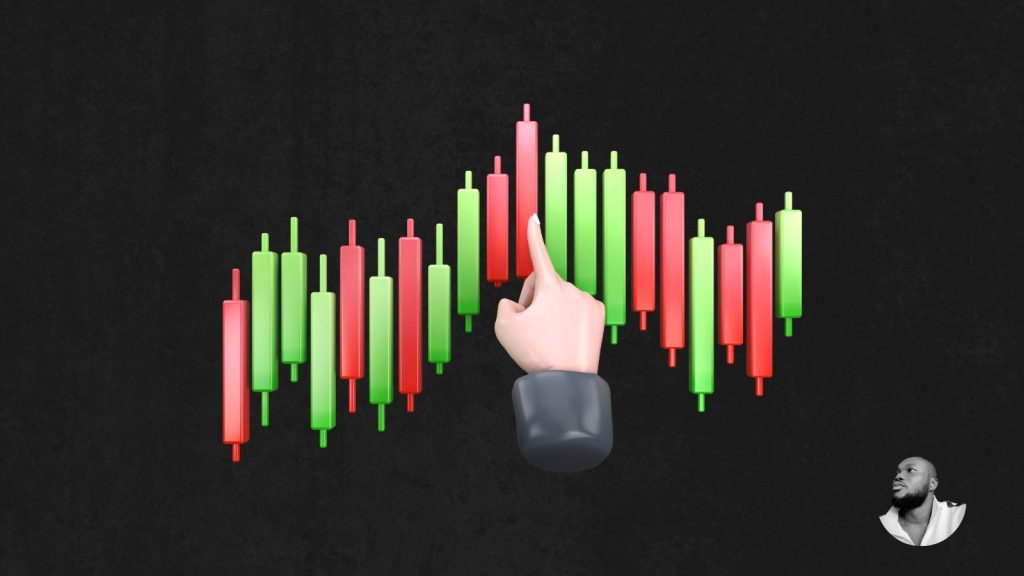
Candlestick patterns have long been a cornerstone of technical analysis, offering traders a visual representation of price action that can be instrumental in predicting market trends. In the volatile world of cryptocurrency, where market dynamics can shift rapidly, understanding these patterns is crucial for making informed trading decisions. Candlestick charts, with their origins in 18th-century Japan, provide a wealth of information through their simple yet effective design. Each candlestick represents a specific time frame, encapsulating the opening, closing, high, and low prices. This visual format allows traders to quickly assess market sentiment and potential future movements.
One of the most fundamental candlestick patterns is the Doji, which occurs when the opening and closing prices are virtually identical. This pattern signifies indecision in the market, as neither buyers nor sellers have gained control. In the context of a strong trend, a Doji can indicate a potential reversal or a period of consolidation. However, it is essential to consider the Doji in conjunction with other indicators and patterns to confirm its significance. Transitioning from the Doji, the Hammer and Hanging Man patterns also play a pivotal role in technical analysis. Both patterns have a small body and a long lower shadow, but their implications differ based on their position within a trend. A Hammer, appearing at the bottom of a downtrend, suggests a potential reversal to the upside, as it indicates that buyers are beginning to gain strength. Conversely, a Hanging Man, found at the top of an uptrend, may signal a reversal to the downside, highlighting the weakening of the buying momentum.
Furthermore, the Engulfing pattern, consisting of two candlesticks, provides additional insights into market dynamics. A Bullish Engulfing pattern occurs when a small bearish candle is followed by a larger bullish candle, completely engulfing the previous day’s body. This pattern suggests a shift in sentiment from bearish to bullish, often leading to a price increase. On the other hand, a Bearish Engulfing pattern, where a small bullish candle is followed by a larger bearish candle, indicates a potential downturn as selling pressure intensifies. These patterns are particularly useful in identifying trend reversals and can be powerful tools when used alongside other technical indicators.
In addition to these individual patterns, traders often look for formations such as the Morning Star and Evening Star, which consist of three candles and signal potential reversals. A Morning Star, appearing at the end of a downtrend, is characterized by a long bearish candle, followed by a small-bodied candle, and then a long bullish candle. This formation suggests a transition from selling to buying pressure. Conversely, an Evening Star, found at the end of an uptrend, indicates a shift from buying to selling pressure, often leading to a price decline.
While candlestick patterns provide valuable insights, it is important to remember that they are not infallible. Market conditions, external factors, and the inherent volatility of cryptocurrencies can all influence the effectiveness of these patterns. Therefore, traders should use candlestick analysis in conjunction with other technical indicators, such as moving averages and volume analysis, to enhance their predictive accuracy. By mastering candlestick patterns and integrating them into a comprehensive trading strategy, traders can better navigate the complexities of the crypto market and improve their ability to forecast future trends.
Quick Tips for Effective Technical Analysis
To master technical analysis in the crypto market, consider the following tips:
- Combine Indicators: Use multiple indicators to confirm signals and reduce false positives.
- Stay Informed: Keep up with market news and events that could impact prices.
- Practice Patience: Technical analysis is not foolproof; be patient and wait for clear signals.
- Backtest Strategies: Test your strategies on historical data to evaluate their effectiveness.
FAQs
1. What is technical analysis in the context of cryptocurrency?
Technical analysis in cryptocurrency involves evaluating market trends and price movements using historical data, charts, and statistical indicators to predict future price movements.
2. What are some key indicators used in technical analysis for crypto markets?
Key indicators include Moving Averages (MA), Relative Strength Index (RSI), Moving Average Convergence Divergence (MACD), Bollinger Bands, and Fibonacci Retracement levels.
3. How does the Relative Strength Index (RSI) help in predicting market trends?
RSI measures the speed and change of price movements, indicating overbought or oversold conditions. An RSI above 70 suggests a market may be overbought, while below 30 indicates it may be oversold.
4. What role do Moving Averages play in technical analysis?
Moving Averages smooth out price data to identify trends over a specific period. They help traders determine support and resistance levels and signal potential buy or sell opportunities.
5. Why is understanding market trends important in crypto trading?
Understanding market trends helps traders make informed decisions, manage risks, and optimize entry and exit points, ultimately aiming to enhance profitability in the volatile crypto market.
Conclusion
This article provides a comprehensive guide to understanding and utilizing technical analysis for cryptocurrency trading. It emphasizes the importance of key indicators such as moving averages, RSI, MACD, and Fibonacci retracements, among others, to forecast market trends and make informed trading decisions. By combining these tools with a disciplined approach and continuous learning, traders can enhance their ability to anticipate market movements and improve their overall trading performance. The book concludes that while technical analysis is a powerful tool, it should be used in conjunction with other strategies and market insights to effectively navigate the volatile crypto market.
Mastering technical analysis is essential for predicting market trends in the volatile world of cryptocurrency. By understanding and utilizing key indicators such as moving averages, RSI, Bollinger Bands, and MACD, traders can make more informed decisions and improve their chances of success. Remember to combine indicators, stay informed, and practice patience to navigate the crypto market effectively.
I also wrote about How to Analyze Crypto Projects: Research Methods Every Investor Should Know, you can check it out.
The Crypto Watchlist of the Week 🔎
Subscribe to receive expert-curated projects with real potential—plus trends, risks, and insights that matter. Get handpicked crypto projects, deep analysis & market updates delivered to you.

 Case Study: Bitcoin’s 2020 Bull Run


